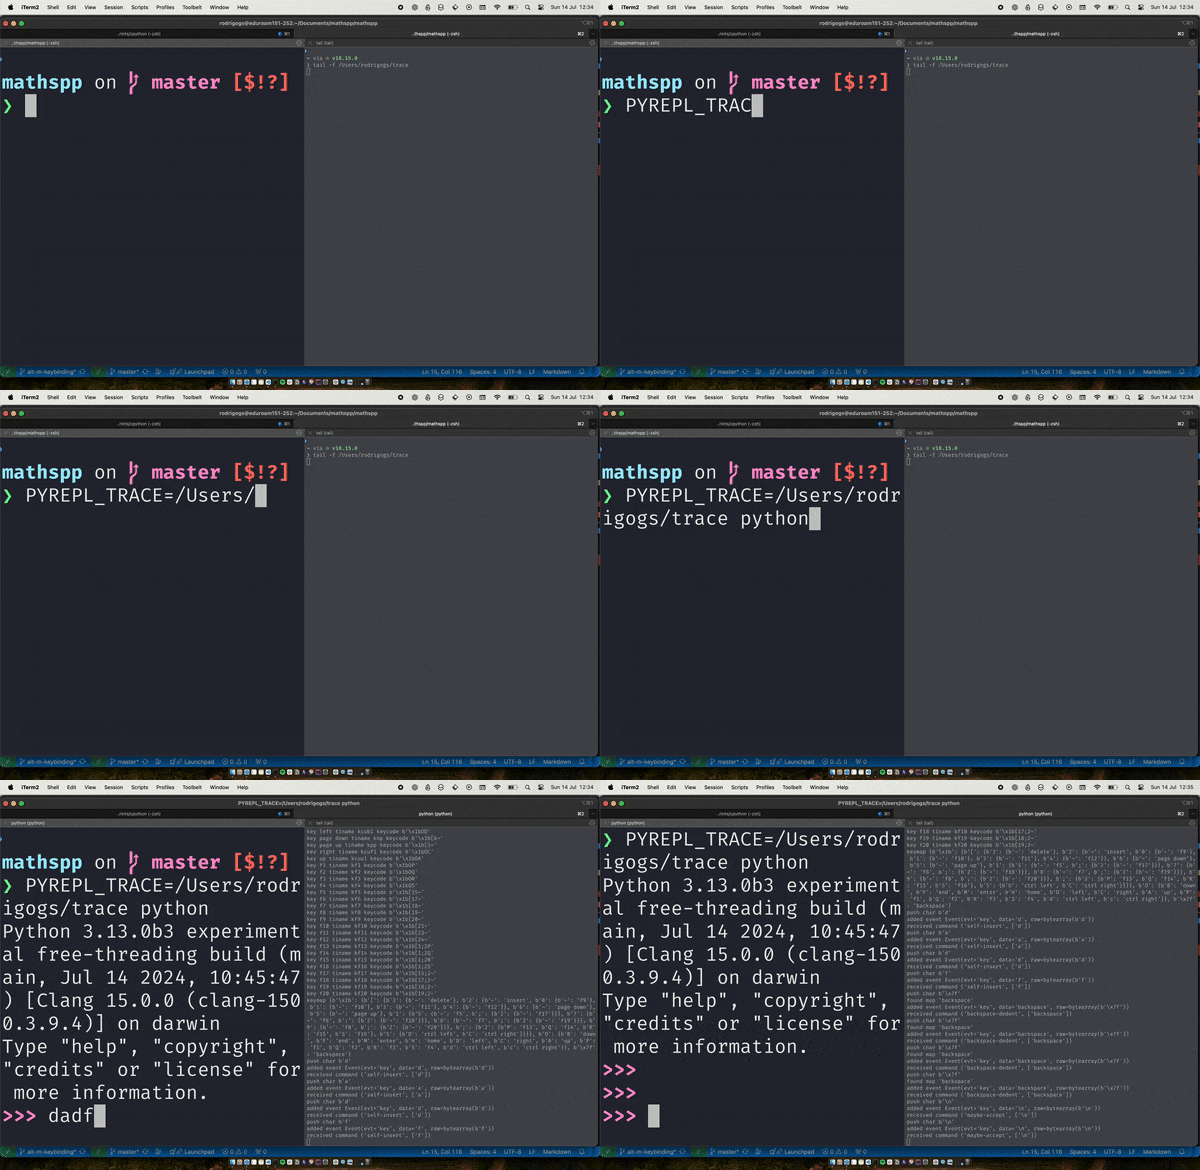
Debugging the new Python REPL with trace and PYREPL_TRACE
As of Python 3.13, the Python REPL is written in Python.
This means that if you are debugging the REPL and add a call to print in the code for the REPL, and then run the REPL, the debugging prints will show up in the REPL, in the middle of the thing you are trying to debug.
This can get quite confusing.
To help alleviate this issue, the REPL includes a short submodule trace that implements the function trace, which can be used for debugging.
It is similar to the function print, but instead of writing to the console it will write to a file.
The environment variable PYREPL_TRACE can then be used to set the path to the file to where trace.trace writes.
In practice, what I do (thanks, Łukasz) is I have two terminals next to each other, run tail -f PATH_TO_FILE in one, and run PYREPL_TRACE=PATH_TO_FILE python in the other, and this opens the REPL and prints the tracing live to my second terminal window.
If you have Python 3.13 installed, you can try this out for yourself:

Become the smartest Python 🐍 developer in the room 🚀
Every Monday, you'll get a Python deep dive that unpacks a topic with analogies, diagrams, and code examples so you can write clearer, faster, and more idiomatic code.
